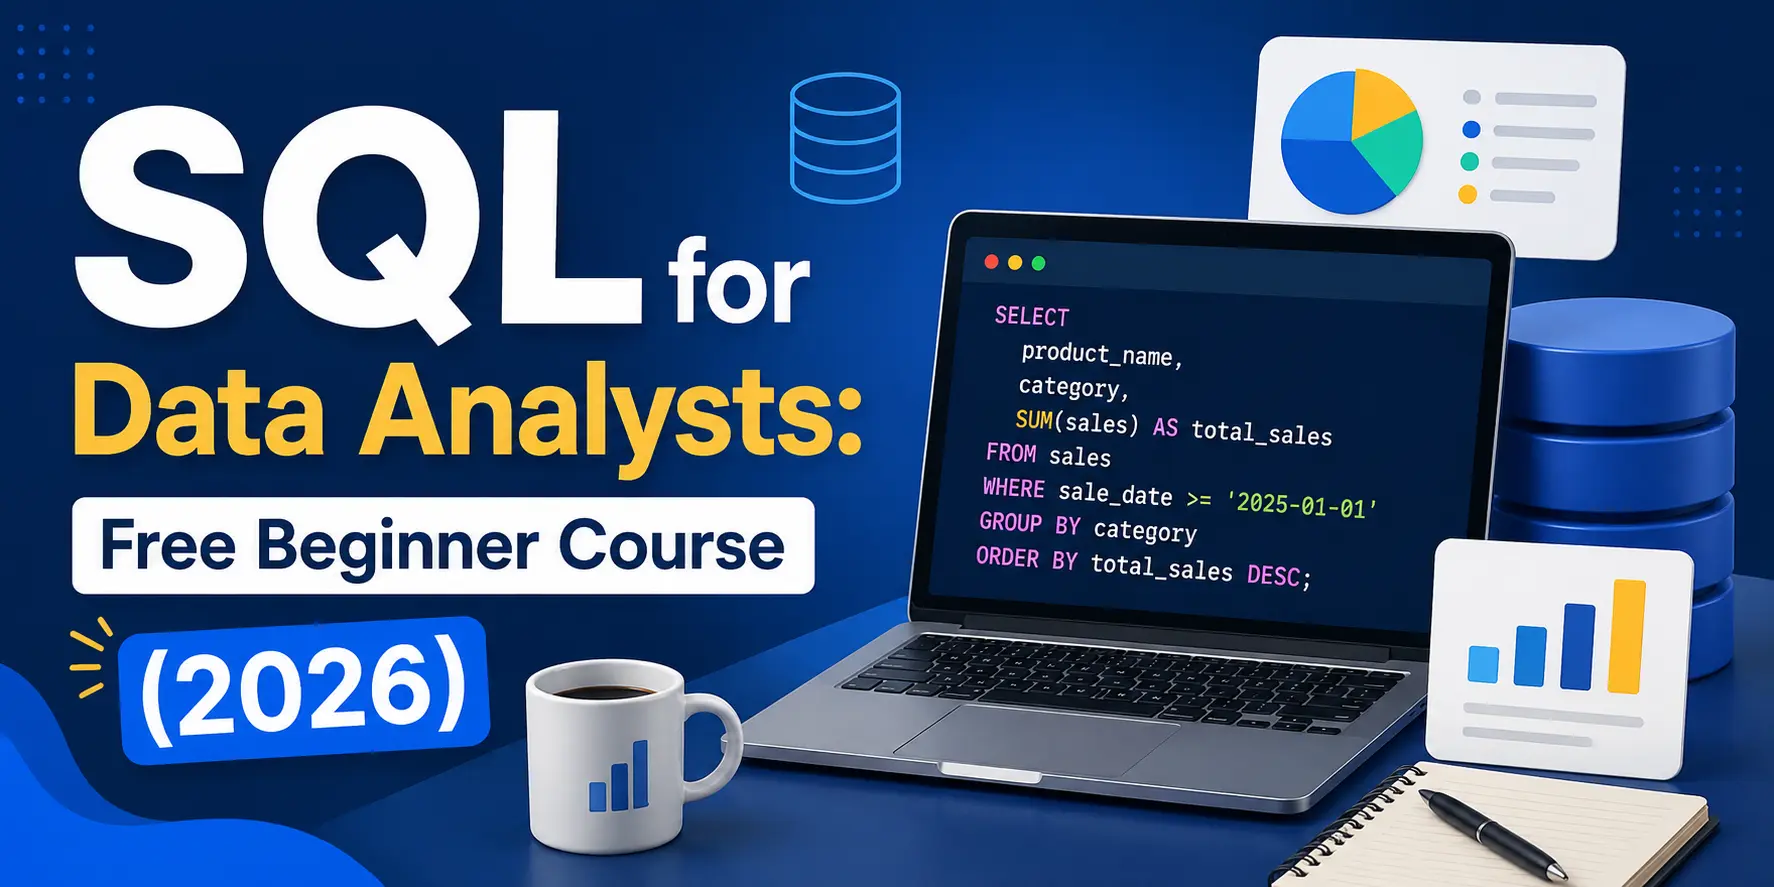
SQL for Data Analysts: Beginner’s Guide (2026)
Read enough job postings for a Data Analyst role in India and you'll notice something: the requirements section rarely agrees on much — some companies want Python, some want Power BI, some want three years of "stakeholder management" experience for what is clearly a fresher role. But one line shows up almost everywhere. SQL.
That's not a guess. A 2026 review of Data Analyst listings on Naukri and LinkedIn found SQL required — not "preferred," required — in over 90% of postings. And the demand behind those postings is real: Glassdoor was showing more than 6,400 open Data Analyst roles in India in any given week this year, spread well beyond the usual
Bengaluru–Hyderabad–Pune cluster. Coursera's 2026 India skills report puts the country's data analytics market on track to grow by roughly 35.8% between 2025 and 2030. So if you've read our guides on Data Analyst salaries or data science jobs in India and thought "okay, but where do I actually start" — this is the honest answer. You start with SQL for data analysts, and you start here.
This is a structured way to learn exactly the SQL you'll use on the job — not the entire language, just the part that shows up in real analyst work.
Why SQL for data analysts specifically (not SQL in general)
Full SQL courses often try to turn you into a database administrator — user permissions, backups, server tuning, the works. None of that is what a Data Analyst does day to day. The version you actually need is narrower and far more learnable: you're mostly asking a database questions and getting answers back as clean tables you can report on.
That narrower scope is good news. Multiple independent 2026 roadmap breakdowns — from training providers tracking what analysts actually use on the job — converge on the same finding: the core of SQL for data analysts is really just four ideas, and a beginner with zero coding background can get comfortable with all four in about four to six weeks of steady practice.
What SQL actually is, in plain language
SQL (Structured Query Language) is how you talk to a database. Not code in the "build an app" sense — more like a very precise way of asking a question. Instead of scrolling through an Excel sheet with 200,000 rows looking for last month's orders from Delhi, you write one query, and the database hands you exactly that slice of data in a second or two.
That's the entire point of learning this: it lets you ask better questions of bigger data than a spreadsheet can comfortably hold.
The four SQL concepts that cover most real analyst work
1. SELECT — retrieving data
Every query starts here. You're telling the database which columns you want to see.
SELECT name, city, order_amount
FROM orders;
2. WHERE — filtering
Now you narrow it down to only the rows that matter.
SELECT name, city, order_amount
FROM orders
WHERE city = 'Delhi';
3. JOIN — combining tables
This is the concept that trips up almost every beginner, and also the one that makes this skill genuinely powerful for real analyst work. Real business data never lives in one table — your orders are in one table, your customers in another, your products in a third. A JOIN lets you pull related information across tables in a single query.
SELECT customers.name, orders.order_amount
FROM orders
JOIN customers ON orders.customer_id = customers.id;
4. GROUP BY — aggregating
This is how you go from raw rows to an actual insight — totals, averages, counts.
SELECT city, SUM(order_amount) AS total_sales
FROM orders
GROUP BY city;
Learn these four well, in this order, and you can already answer most of the questions a manager will actually ask you: Who are our top customers? Which city sold the most last quarter? What's our average order value?
A worked example, start to finish
Imagine a simple orders table with columns for customer_name, city, and amount. Here's how a real analyst's thinking builds up, query by query:
- "Show me everything." SELECT * FROM orders;
- "Just Mumbai orders." SELECT * FROM orders WHERE city = 'Mumbai';
- "Which customers are they?" — bring in a customers table with a JOIN
- "What's the total per city?" — GROUP BY city with SUM(amount)
That's genuinely what real analyst work looks like day to day — a chain of increasingly specific questions, each one a small step up from the last.
Free tools to practice with — no installation needed
You don't need to install any database software to start. Two well-established, genuinely free options:
- SQLZoo — browser-based interactive tutorials with real datasets (a BBC country-profile table, a Nobel Prize winners table), covering everything from basic SELECT to joins, subqueries, and aggregate functions, with quizzes built in.
- SQLBolt — a shorter, cleaner set of interactive lessons that walks from a first SELECT query through JOINs, NULLs, and aggregates, entirely in-browser.
If you later want a proper reference for a specific database system, the official PostgreSQL documentation is free, thorough, and a good habit to build — reading real documentation instead of only tutorials is part of actually becoming job-ready.
A realistic timeline (not a "learn it in a weekend" promise)
Every credible 2026 roadmap we found agreed on the same rough timeline: four to six weeks to get genuinely comfortable with SELECT, WHERE, JOIN, and GROUP BY, assuming regular practice rather than a single weekend binge. That's a fair estimate, and it's worth trusting over anything promising fluency overnight — SQL rewards steady, small daily practice far more than long cramming sessions.
If a self-paced timeline like that feels slower than you'd like, that gap is exactly why structured, mentor-led courses exist — it's the same four-to-six-week core we teach hands-on inside our Diploma in Data Analytics & AI, just with feedback on your actual queries instead of guessing whether you got it right.
Common beginner mistakes
- Confusing WHERE and HAVING — WHERE filters rows before grouping; HAVING filters after grouping. Mixing these up is probably the single most common beginner error.
- Forgetting the JOIN condition — leave out the ON clause and you'll get a confusing explosion of duplicate rows instead of an error message, which is worse.
- Overusing SELECT * in real work — fine for exploring, but pulling every column when you only need three makes queries slower and reports messier.
- Not testing on a small slice first — always check a query against a handful of rows before running it against the full table.
What comes after SQL
Once SQL for data analysts feels comfortable, the natural next steps — in the order most working analysts actually pick them up — are a visualization tool like Power BI (a full setup guide is coming next in this series), Excel for smaller ad-hoc analysis, and Python once you're ready to automate repetitive cleaning work. None of these replace SQL; they build on top of it; SQL usually stays the tool you reach for first when you need an answer straight from the source data.
If you're also weighing whether this career path is worth the time investment, our guides on Data Analyst Salary in India 2026 and Data Science Jobs in India 2026 cover what the market is actually paying and hiring for — this post is simply the first skill to check off that path.
FAQ
- Do I need a coding background to learn SQL?
No. SQL reads closer to plain English than most programming languages — SELECT, WHERE, JOIN, GROUP BY — and most people with zero prior coding experience can write working queries within their first week of practice. - How long does it take to learn SQL for data analysts?
Most 2026 industry roadmaps put the core basics — SELECT, WHERE, JOIN, GROUP BY, subqueries — at four to six weeks of regular practice. Going deeper (window functions, query optimization) takes longer, but isn't necessary to start applying for junior analyst roles. - Is SQL really required for data analyst jobs in India?
Yes — recent analysis of job postings found it listed as a required skill in over 90% of Data Analyst listings on Naukri and LinkedIn, ahead of Python, Excel, or any single visualization tool. - What should I learn after SQL?
Most analysts move to a visualization tool (Power BI or Tableau) next, followed by Excel for smaller day-to-day work and Python once they're ready to automate data cleaning.
Still confused? DizitalAdda's structured Data Analyst course is for you
If you've read this far and you're still not sure whether you'd actually remember a JOIN a week from now, that's normal — and it's not a sign you're bad at this. It just means self-study alone doesn't work for everyone, and there's no shame in wanting a structured path instead of piecing one together from some tutorials and YouTube videos in a random order.
That's exactly the gap our Diploma in Data Analytics & AI is built to close. Instead of guessing which free resource to trust next, you get SQL, Power BI, and Python taught together, in the same sequence working analysts actually use them — with a mentor checking your actual queries instead of a quiz just telling you "correct" or "incorrect." If SELECT, JOIN, and GROUP BY still feel shaky after this post, that's the natural next step, not a failure.
Practicing a few queries on SQLZoo or SQLBolt this week is still worth doing either way — it'll tell you fairly quickly whether you'd rather keep going solo or want that structure from day one.